Reaction Plan Manager++ Shop Floor View
Introduction
The Reaction Plan Manager®++ software is designed to guide
machine operators through the process of adjusting their machine
to prevent machine down time. It provides current process information.
It does not provide a history of events. What happened last shift?
Did the operator measure his parts? How many events occurred over
that time? Did the operator make the machine corrections as outlined
in the reaction plan? Based on a history are there any features that
need attention by engineering? The Reaction Plan Manager ®++ Shop Floor View
software is used by management and engineering to answer these types of
questions. It displays current process status information and provides
tools to view a history of events with data analytics.
How It Works
While your machine operators are measuring parts and using the Reaction
Plan Manager®++ software to get machine adjustment instructions the results
of each analysis are stored in a database. The Reaction Plan Manager++
Shop Floor View software will use the captured data to show the status of
each process (machine) in a dashboard and provide tools to drill down into
the data to get detailed report information.
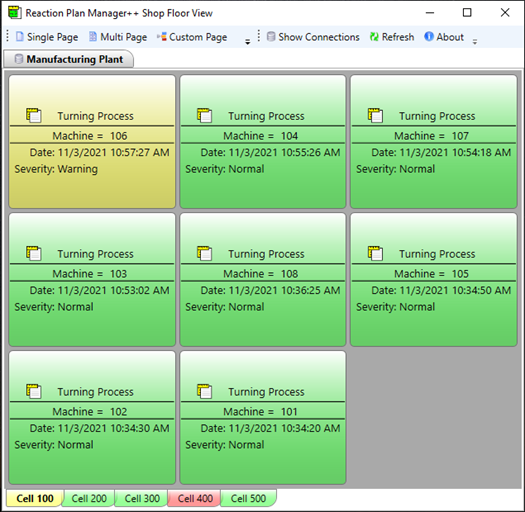
Process Status Dashboard
Displays current Process Status information. The dashboard contains process
status buttons. Each button identifies the process (machine) and has a
background color of green, yellow, or red which is normal, warning, and critical
severity, respectively. How those buttons are grouped are customizable and organized
by date. At a glance you can identify which process is having problems and the last
time data was analyzed for each. A click of a button lets you drill down into
the event data.
Used as a Management Tool
A manager can see exactly what process control information the operator saw
at any given time for each machine. Using this information, he/she can
determine if parts are being measured to control the process and if the operators
are using the information to make machine corrections. The data analytics will
help identify where to allocate engineering resources.
Used as an Engineering Tool
Data analytics give engineers tools to quickly pinpoint features that require
attention. Detailed process information is provided to help diagnose and resolve
process problems.
Benefits
- Better allocation of resources. Understanding what happened in the past makes it easier to plan for the future.
- Cost savings from a reduction in engineering hours supporting the shop floor, machine down time and scrap.